New Website Feature: A Tool for Identifying Spectra of Mixtures
I am proud to introduce a new utility that you can use to identify spectral lines in a photo of a spectrum of an element mixture. While individual elements on their own are often easy to identify by their distinctive patterns of color and spacing, mixtures complicate this by introducing lines that break up and obscure those patterns. That's where this new utility comes in handy.
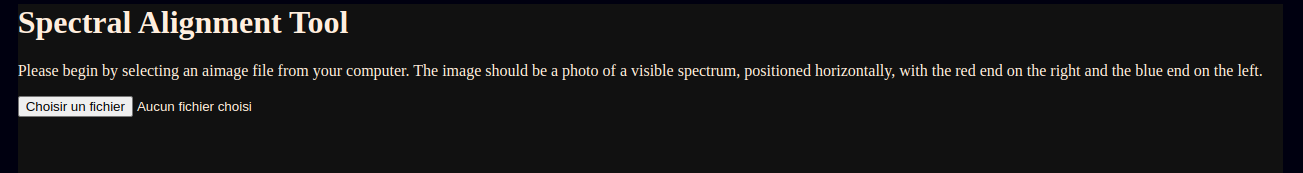
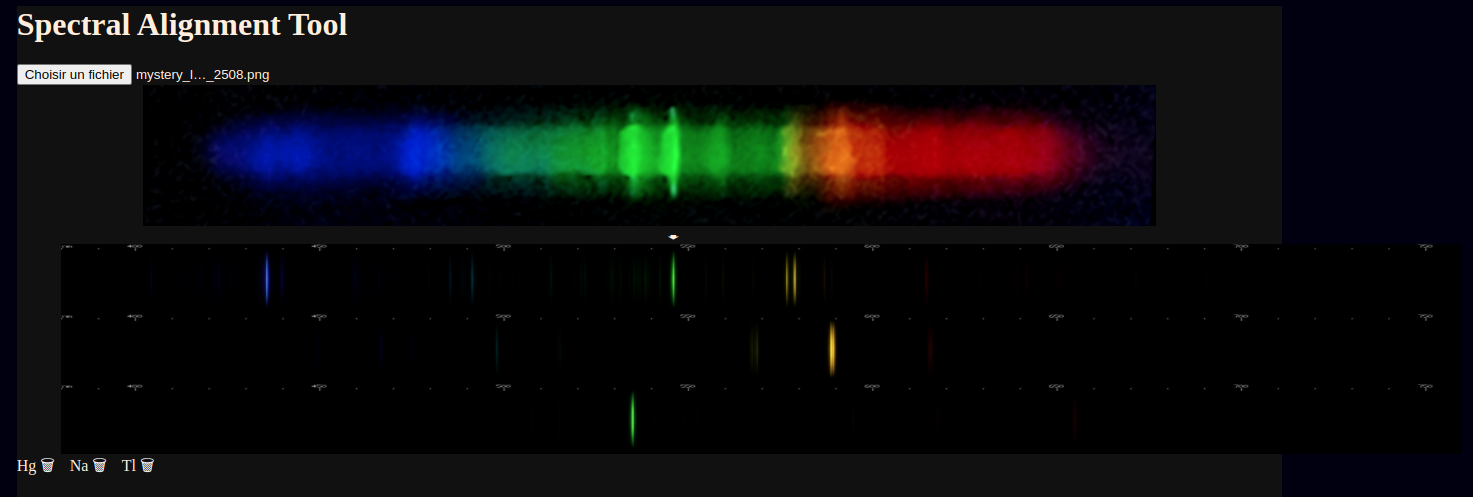
After selecting a photograph of the spectrum of a metal halide lamp, a periodic table appears allowing selection of unlimited elements for alignment.
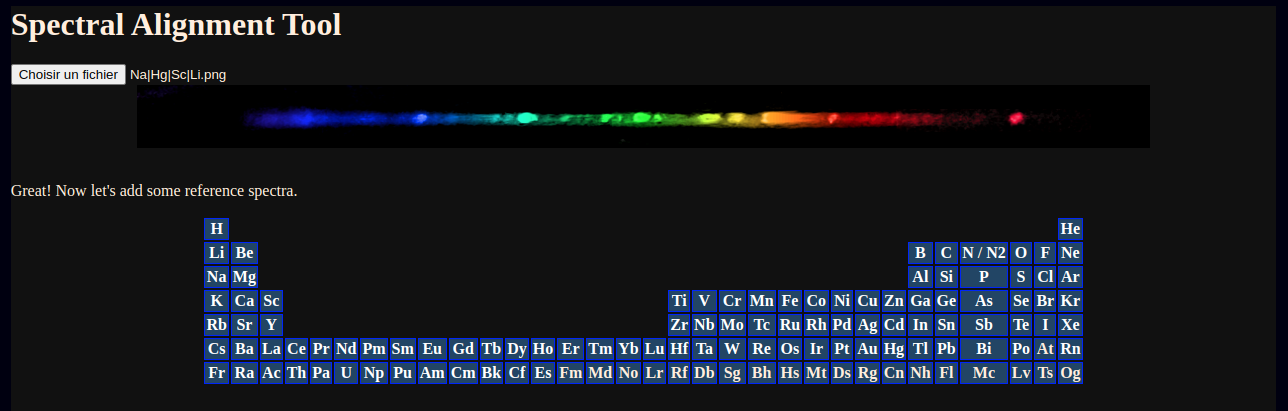
Since the elements present are already known, I can just add them and follow the on-screen prompts to line them up.
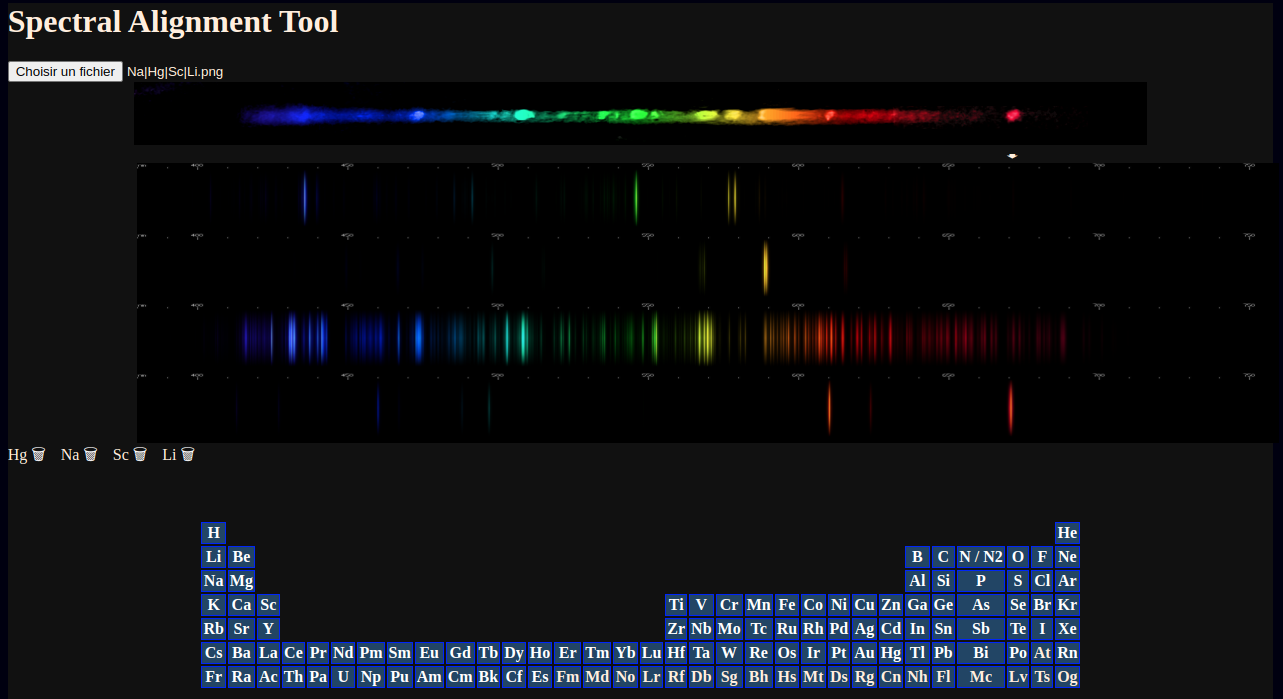
Not shown: moving the mouse along the images also tracks a vertical line and gives a wavelength estimate of the mouse's position.
A Mystery
Recently, I was out driving for a major rideshare platform when, while waiting for a passenger who never showed up, I happened to notice a new kind of lamp that I'd never seen before.
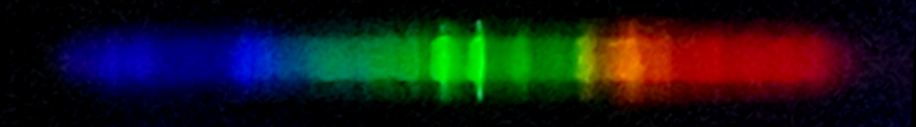
Unfortunately, the camera didn't do a great job of capturing a clear image of the red and blue regions, but visually both consisted of sharp well defined lines. I was not in a place to record a visual observation. Right away, a few elements can be clearly identified: mercury, sodium, and what appears to be thallium.
After loading the image into the new utility, and using the mouse to align the spectra, we can see that thallium does indeed line up with the less intense of the two bright green lines.
However, using the mouse tracking line, we can measure mystery lines near 423, 444, 446, 476, 480, 483, 495-508, 512-521, 526, 532-541, 559, 563-572, 584, 592, 602, 611, 617, 627, 632, 637, 640, 646, 649, and 656 nanometers wavelength.
The bluish lines near 480nm somewhat suggest manganese; the diffuse brightness near 560nm resembles a calcium multiplet; the series of red lines and one amber-yellow line recall neon, but all of these elements are imperfect matches to the photo. The bright orange line at 592-593nm is unaccounted for, unless it is the sodium doublet displaced by a curvature in the diffraction grating.
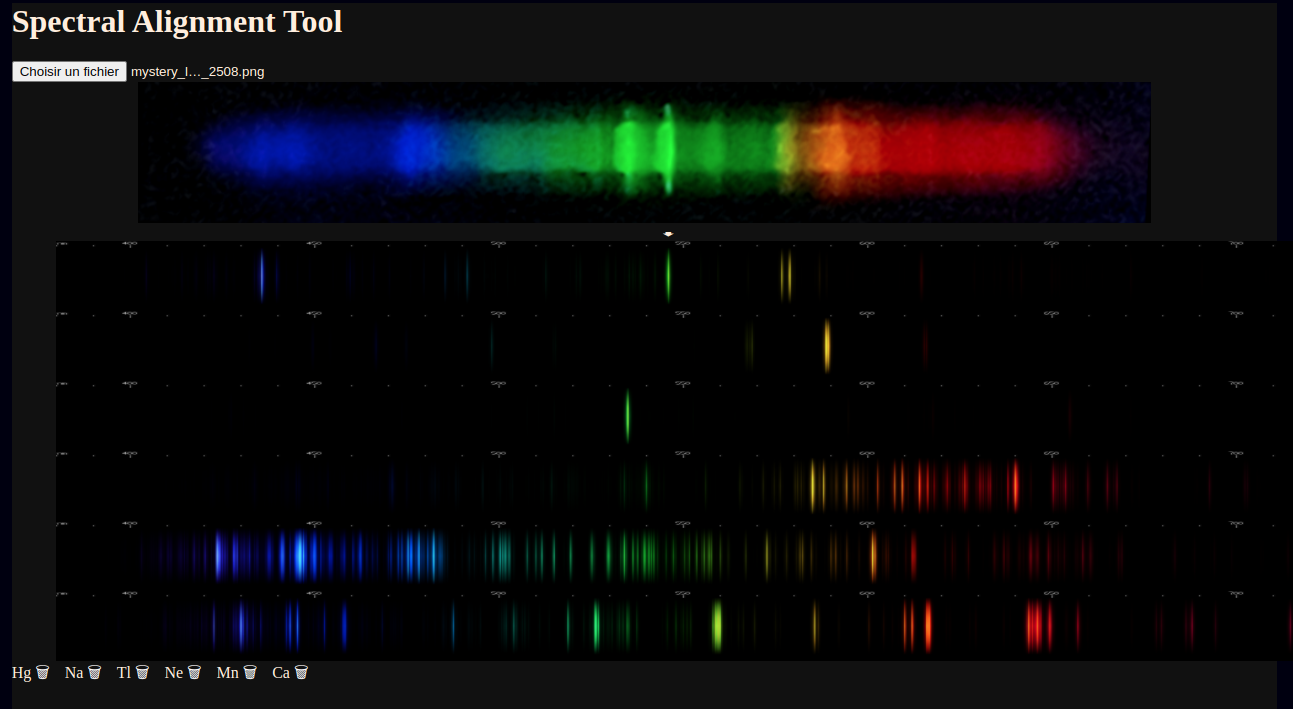
For now, this lamp's composition remains a mystery. If you'd like to try your hand at decoding this lamp's spectrum, you can download the image here and access the new utility here. Or use the new utility for identifying spectra of any other mixtures that you might have. If you happen to know what's in this type of lamp to give it that unusual mix of wavelengths, please let me know.